
K-Means is an unsupervised clustering algorithm, which allocates data points into groups based on similarity.K-means clustering is a simple and elegant approach for partitioning a data set into K distinct, non-overlapping clusters. To perform K-means clustering, we must first specify the desired number of clusters K; then the K-means algorithm will assign each observation to exactly one of the K clusters [1].
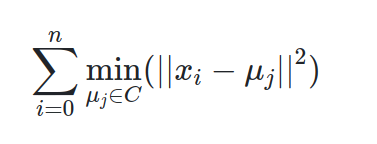
The K-means algorithm clusters data by trying to separate samples in n groups of equal variance, minimizing a criterion known as the inertia or within-cluster sum-of-squares. The K-means algorithm aims to choose centroid that minimise the inertia, or within-cluster sum-of-squares criterion [2]
How does it work?
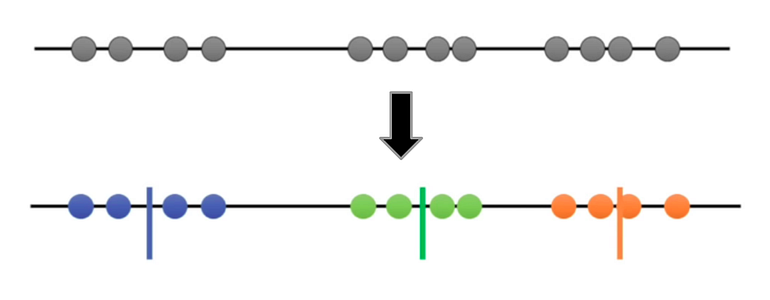
There are several steps to explain it. For instance, there is data provided below
Here, I will explain step by step how k-means works
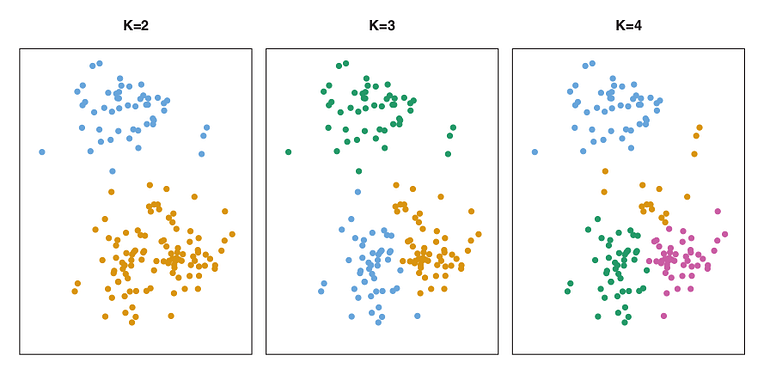
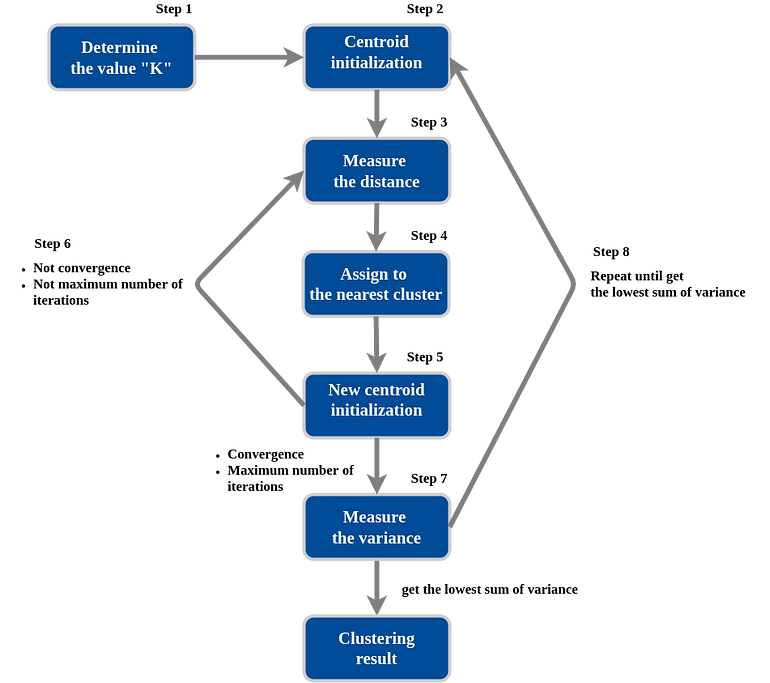
Step 1. Determine the value “K”, the value “K” represents the number of clusters.
in this case, we’ll select K=3. That is to say, we want to identify 3 clusters. Is there any way to determine the value of K? yes there is, but we’ll talk later about it.
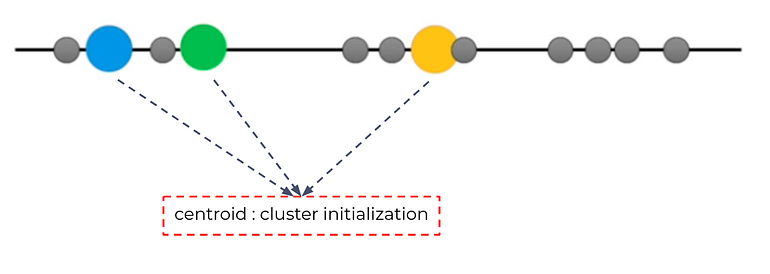
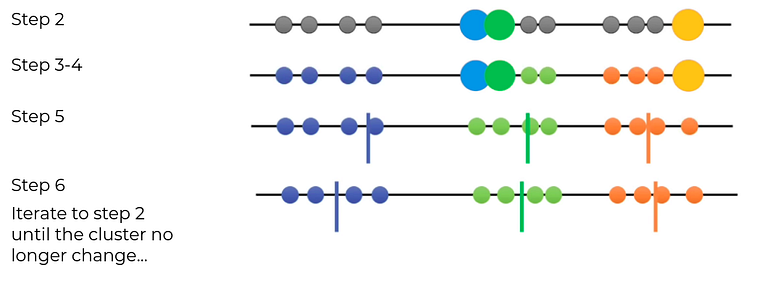
Step 2. Randomly select 3 distinct centroid (new data points as cluster initialization)
for example — attempts 1. “K” is equal 3 so there are 3 centroid, in which case it will be the cluster initialization.
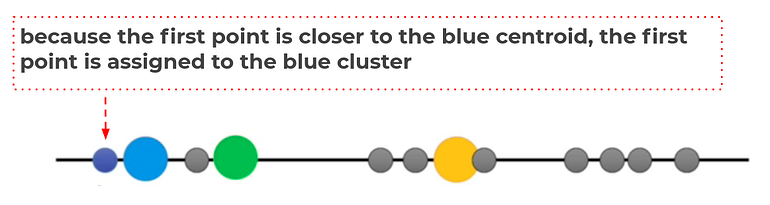
Step 3. Measure the distance (euclidean distance) between each point and the centroid
for example, measure the distance between first point and the centroid.
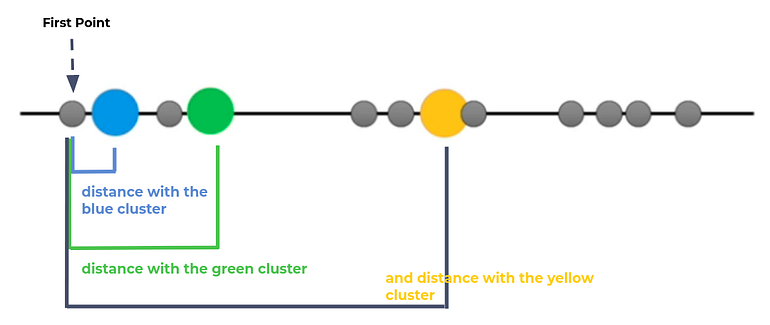
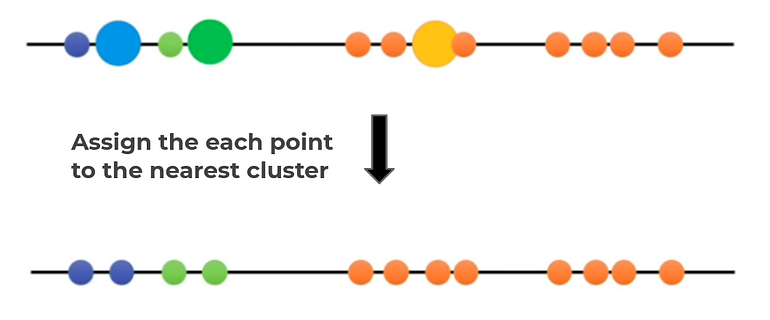
Step 4. Assign the each point to the nearest cluster
for example, measure the distance between first point and the centroid.
Do the same treatment for the other unlabeled point, until we get this
Step 5. Calculate the mean of each cluster as new centroid.
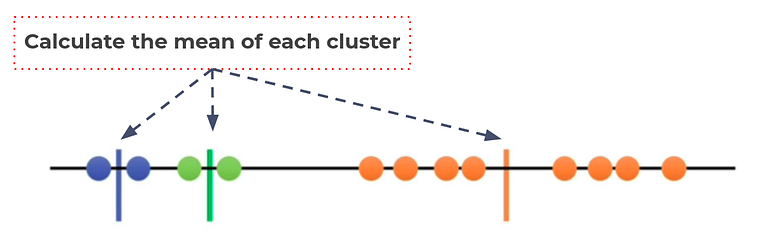
Update the centroid with mean of each cluster
Step 6. Repeat step 3–5 with the new center of cluster.
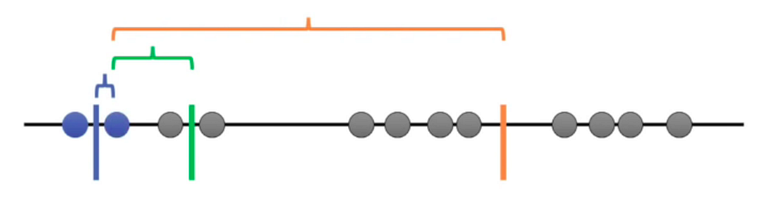
Repeat until stop:
Convergence. (No further changes)
Maximum number of iterations.
Since the clustering did not change at all during the last iteration, we’re done.
Has this process been completed? of course not
Remember, the K-means algorithm aims to choose centroid that minimise the inertia, or within-cluster sum-of-squares criterion
So, how to assess the results of this clustering? let’s continue
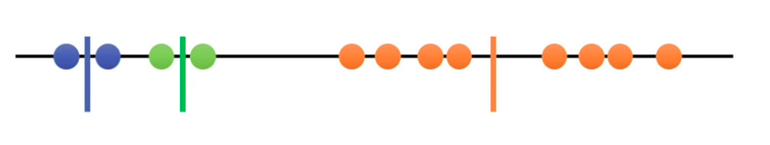
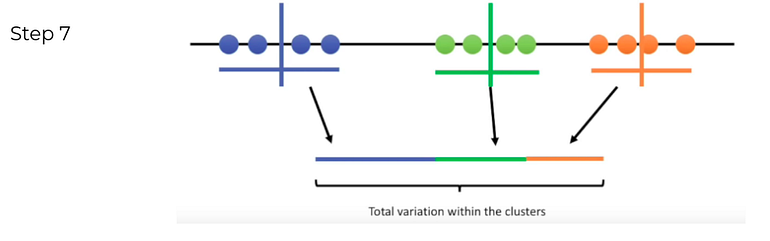
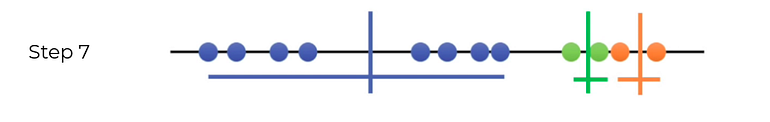
Step 7. Calculate the variance of each cluster
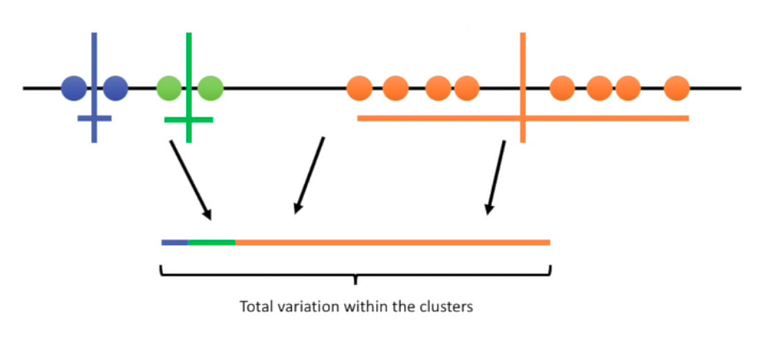
Since K-means clustering can’t “see” the best clustering, it is only option is to keep track of these clusters, and their total variance, and do the whole thing over again with different starting points.
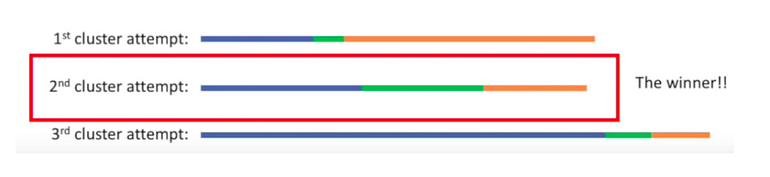
Step 8. Repeat step 2–7 until get the lowest sum of variance
For example — attempts 2 with different random centroid.
For example — attempts 3 with different random centroid
Repeat until stop:
Until we get the lowest sum of variance and pick those cluster as our result
Has this process been completed? Yes
The result of clustering is
K-means Clustering Overview
Choosing K
Since the algorithm requires the user to specify the number of clusters K to look for, and it doesn’t learn it from the data, it is one of the most difficult aspects of using this algorithm. It’s difficult to say if any given value of K is incorrect. Often this value is determined through having extensive domain knowledge, and experience to know an ideal value of K. If this isn’t the case for your current needs then the elbow method is commonly used in the industry to identify the ideal value of K.
Elbow Method
The elbow method uses the sum of squared distance (SSE) to choose an ideal value of k based on the distance between the data points and their assigned clusters. We would choose a value of k where the SSE begins to flatten out and we see an inflection point. When visualized this graph would look somewhat like an elbow, hence the name of the method.
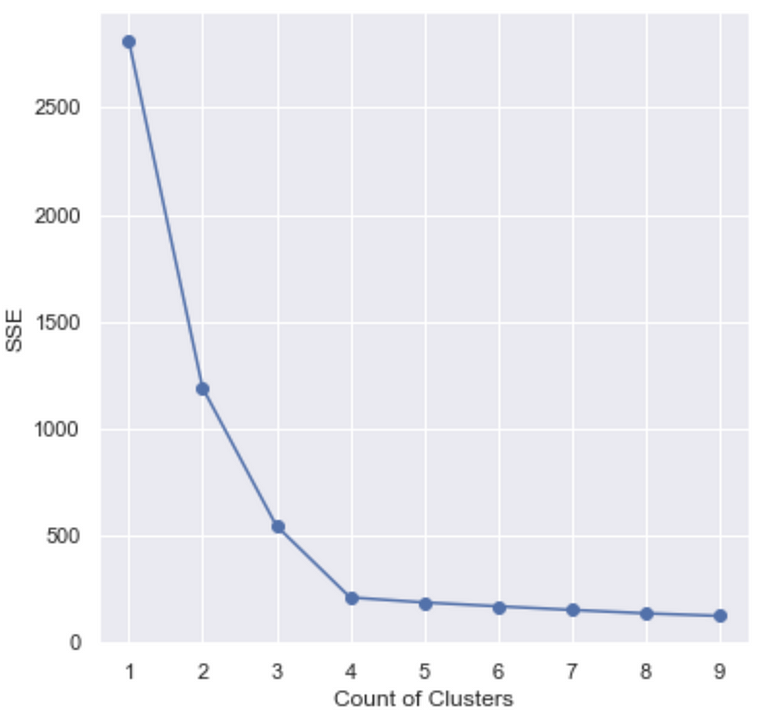
The graph above shows that k = 4 is probably a good choice for the number of clusters. There are situations when the graph does not look like an elbow, this makes things very difficult to choose the value of k. The code to generate the graph above and the modelling component of this algorithm is provided below in the Implementation section of this article.
Advantages
- Scales to large data
- Always converges
- Often (not always) faster than other common clustering methods like hierarchical clustering.
- Clustering imbalanced data
- Manual choice of K
- Dependent on initial assumptions
- Scaling with high dimensions.
0 Response to "K-means"
Post a Comment